Measuring the Cost of Measuring
23 Sep 2025 - Ben Clifford
It is pretty clear to anyone who has fiddled non-trivially with Parsl performance that logging can affect things a lot: it was the main factor in my multi-factor performance analysis earlier this year, and Yadu’s ParslFest 2025 talk found it was significant on ALCF’s Aurora machine.
Usually that manifests as: turn off as much logging as you can and pretend it doesn’t exist, for the purposes of some other benchmark.
But recently I’ve been trying to understand those costs a little bit more, rather than making them go away, because logging is a useful feature for users, primarily for debugging errors and for debugging performance.
This post will summarise one sequence of tests I ran on a cheap OVH dedicated
server I acquired specially for the purpose, measuring using a hacked-up
parsl-perf from the default log settings down to forcing
lower-than-configurable log levels.
These tests were run with the High Throughput Executor, on a single host,
with parsl-perf running two iterations of 150,000 tasks each.
Because it fits in the same space and seemed like it would fit in, I also included an increase in log levels, turning on the worker debug option.
Here’s a plot of the time spent per task (in microseconds) in each of the 4 test configurations:
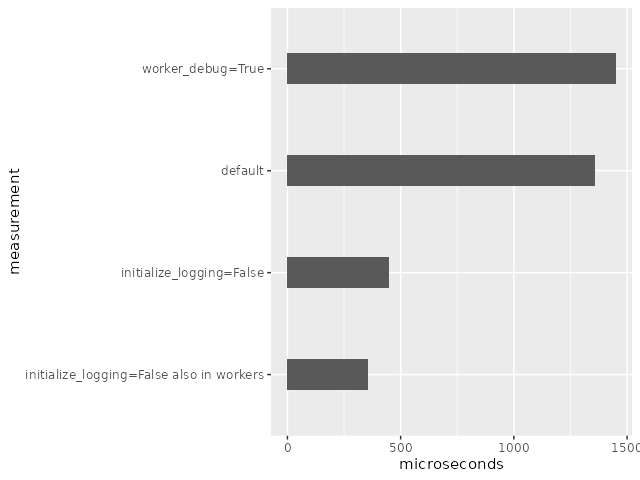
The top bar shows the worst case, with as much logging as possible turned on:
that is the default plus HTEX’s worker_debug option set to True. With that
configuration, the mean time per task is around 1451 microseconds.
Moving down one bar, the default Parsl configuration if you don’t set anything log specific takes around 1360 microseconds per task.
The next two bars deal with disabling logs: the third bar down shows that by
setting initialize_logging=False, the time per task drops drastically to
around 450 microseconds per task; and then the final bar shows that by hacking
the code to make initialize_logging=False also have effect in the HTEX
interchange and workers, the time per task is around 356 microseconds per
task.
Don’t take the absolute values of these numbers too seriously – I get different results on every system I run on – but what’s interesting here is the large portion of time (around 75%) that seems to be attributable to logging.
I’ll try to explain the four different configurations in the context of both Parsl and a superficial description of the Python logging system.
Log message in Python are made with a log level (for example: DEBUG,
INFO, WARNING, ERROR), and log messages are directed to a handler
which in the Parsl case usually writes those messages to a file.
On the submit side, where user workflow code runs, and where Parsl appears
as a library, we discovered (at ParslFest 2019) that some users wanted more
control of where log messages were directed. By default, initializing Parsl
with parsl.load() will set up a handler to direct Parsl’s submit side
log messages to parsl.log. Rather than make complicated log options,
we took a hands off approach: set initialize_logging=False when you
initialize Parsl, and it won’t direct submit side log messages to
parsl.log. Instead, it is up to the user to configure their own handler
that might direct both Parsl and other log messages to some other place.
If you don’t do that, log messages won’t be written out anywhere.
The big change in the plots above, from 1360 microseconds/task to 450 microseconds/task, occurs because those log messages aren’t being written out anywhere. The Python logging system is still given all the messages but it does nothing with them. Most importantly, I think, is that that means there is no filesystem/disk activity due to logging. With logging initialized, a run generates around a gigabyte of log files and with logging uninitialized, a run generates around 85 megabytes.
So, informally, the bulk of this logging time is being spent on disk access.
The other changes are similar but different: on the worker side, logging
is always configured to go to a file and the user only has the choice
to record log messages at DEBUG level, or at a less verbose INFO level.
Setting worker_debug to True increases the log volume and slows
things down, basically following the explanation above.
So what if the user did have a setting like initialize_logging which could turn off the default log handler on the worker side? That’s what the final bottom bar prototypes: I hacked the source code to not initialize the default worker log handlers, and the increase in speed again follows the above explanation of reduced filesystem access.
Conclusion
It’s pretty clear that less logging can make things faster. But I don’t want to remove all logging: it’s useful.
As Parsl has matured and evolved, perhaps our logging needs have changed too. For example, as we are more confident in the codebase behaving correctly, we might move away from logging so much by default.
We might also look at how the cost of writing those same logs can be reduced: for example, to different kinds of storage or with different synchronisation/reliability policies.
I hope to explore those options and report more.
(p.s. spoiler: by deleting most log statements from the source code entirely, my tests run at an even faster 324 microseconds per task, 10% faster than the best configuration above)