Debugging Memory Leaks in LightningBug's Virtual Label Reconstruction Pipeline
31 Aug 2023 - Mark Hereld, Senior Experimental Systems Engineer and Senior Scientist, Argonne National Laboratory
The LightningBug project is building a pipeline for rapid and efficient extraction of the information on the labels pinned underneath insects in museum collections. Hundreds of millions of specimens are in these natural history collections throughout the United States. This data, critical to assessing global change in biodiversity, are almost entirely locked up on the physical labels attached to the specimens, with only a very small percentage of it available digitally. To make matters worse, current methods are inadequate to digitize the tremendous number of specimens in our national collections in less than 50 years.

Figure 1: In the left panel is a specimen prepared using a traditional approach to digitization of pinned insects. The specimen and all of its labels are removed from the pin (notice the pin holes in the labels!) and laid out to be captured by a digital camera, and then reassembled on the pin. This process is very time consuming. In the right panel an animation showing how photogrammetry based on hundreds of images can capture a model, represent its 3D structure with a mesh (in green) and render a lifelike image using image fragments from the original 2D data. You can see the labels under the beetle in the color rendering. (Images courtesy of the LightningBug Project and the Yale Peabody Museum, Division of Informatics, Nelson Rios.)
Addressing the Digitization Challenge
Our approach is to rapidly capture images from all around the specimen with many cameras acting simultaneously. Then, we computationally reconstruct the information by piecing together the fragmentary views in the image set.
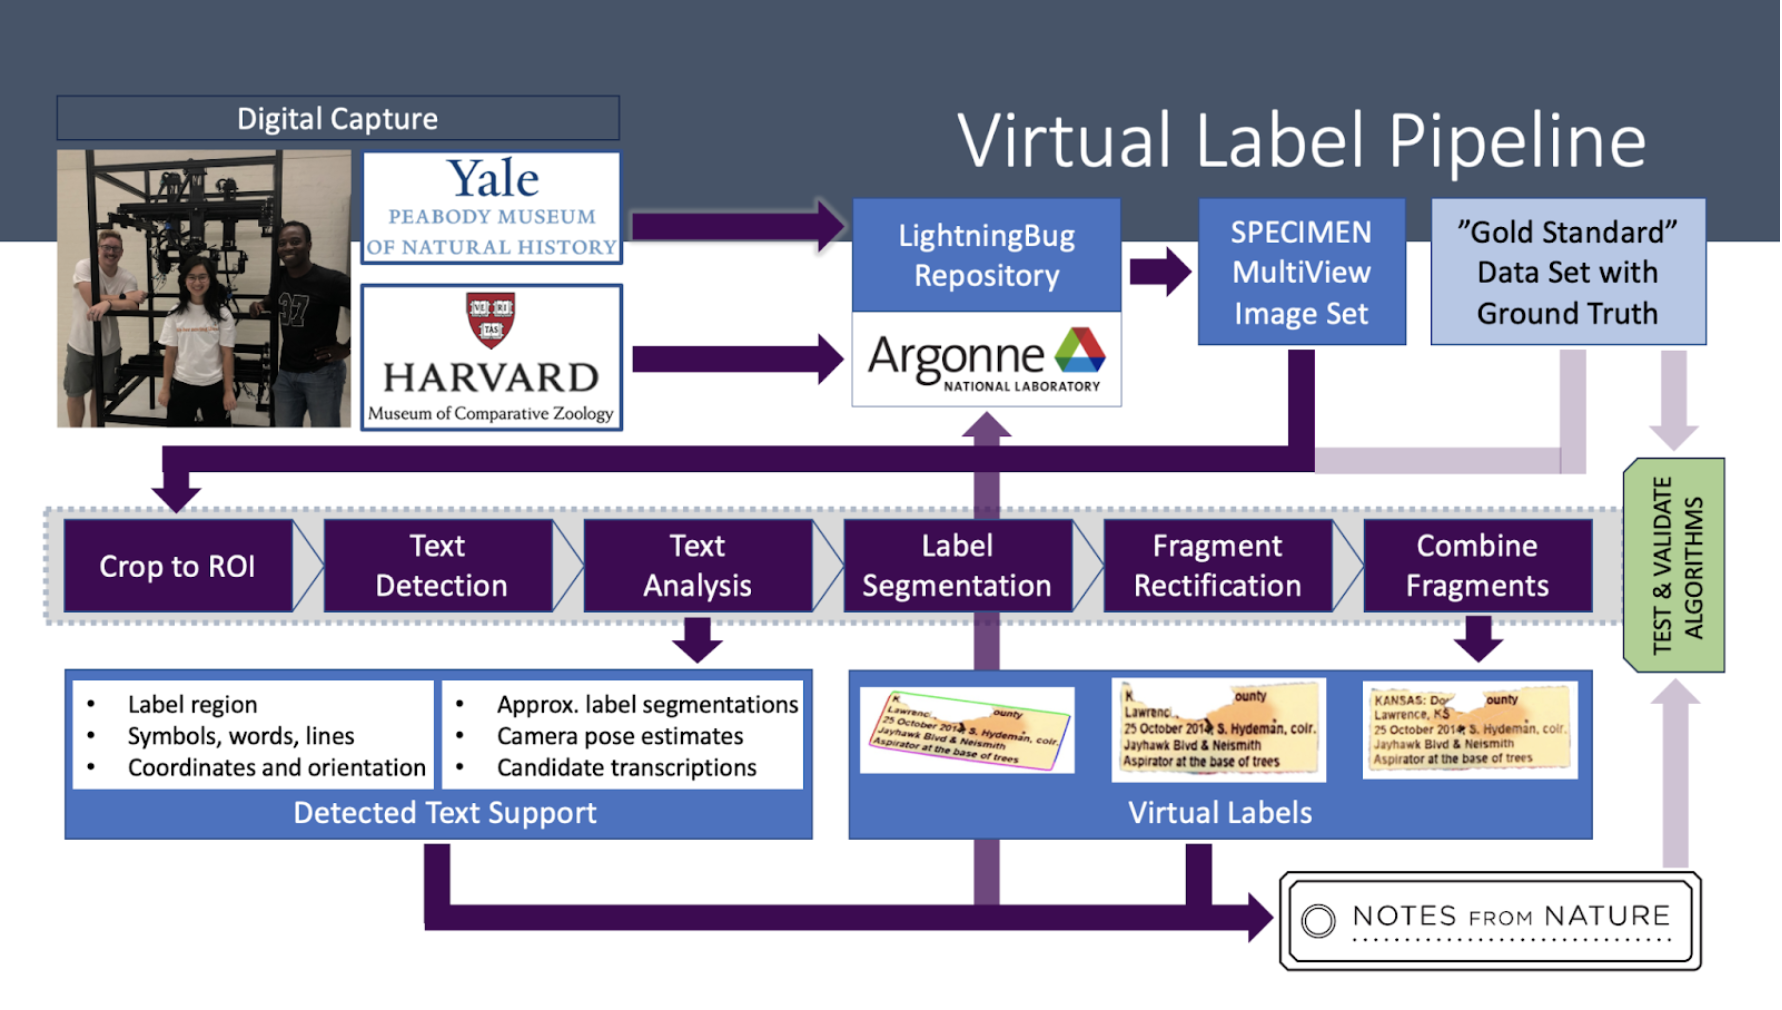
Figure 2: A sketch of the LightningBug pipeline being developed to reconstruct virtual frontal views of all of the labels on a pin (under the insect specimen) from a handful of images taken at points around the specimen. The row of purple boxes in the middle indicates the steps taken in the analysis. The surrounding boxes and arrows give a sense of the overall workflow from capture through analysis and validation to archiving the results. (Image courtesy of the LightningBug Project, Mark Hereld.)
We are using Parsl to enable the pipeline to be developed in pieces on our laptops and then to run at scale using available high performance computing resources. Tests and development of the Parsl framework for the pipeline focused on the “Crop to ROI” step shown in purple in the above diagram. The step is captured in a Python app that loops over the images in a multiview set finds features that signify text on the labels, and provides a bounding box to streamline later calculations.
Uncovering the Issue and Finding the Fix
While testing this step in our pipeline on the Argonne Leadership Computing Facility (ALCF) platform called Theta, we found that at certain scales, the pipeline aborted prematurely. Sometimes, the error message was a bit mysterious:
parsl.executors.high_throughput.interchange.ManagerLost: Task failure due to loss of manager f916dec3894e on host nid00000
On some occasions, though, it clearly indicated a failure while trying to allocate memory.
As a newbie to Parsl, I wasn’t quite sure how to proceed. Where are the clues that would help me to pinpoint the problem and fix it? Thanks to plenty of help from the Parsl team, I enabled monitoring on my app to capture detailed data on memory use per worker. Looking through values dumped from the monitoring database showed lots of variation over time but didn’t help find any patterns. Visualization of the data unlocked the information I needed. Not surprising, I know, but here is what I found.
Looking for memory leaks: The top panel of the plot below shows the virtual memory recorded for four of the 64 workers on a single node as a function of time through the run. Time in seconds is on the horizontal axis, and memory per worker is on the vertical axis. Each worker carried out about 15 invocations of the single app being tested here, which performed an analysis on each of the 24 images. This plot indicates that there is no task-to-task increase in the virtual memory as the baseline is stable, just the waxing and waning between high and low water marks.
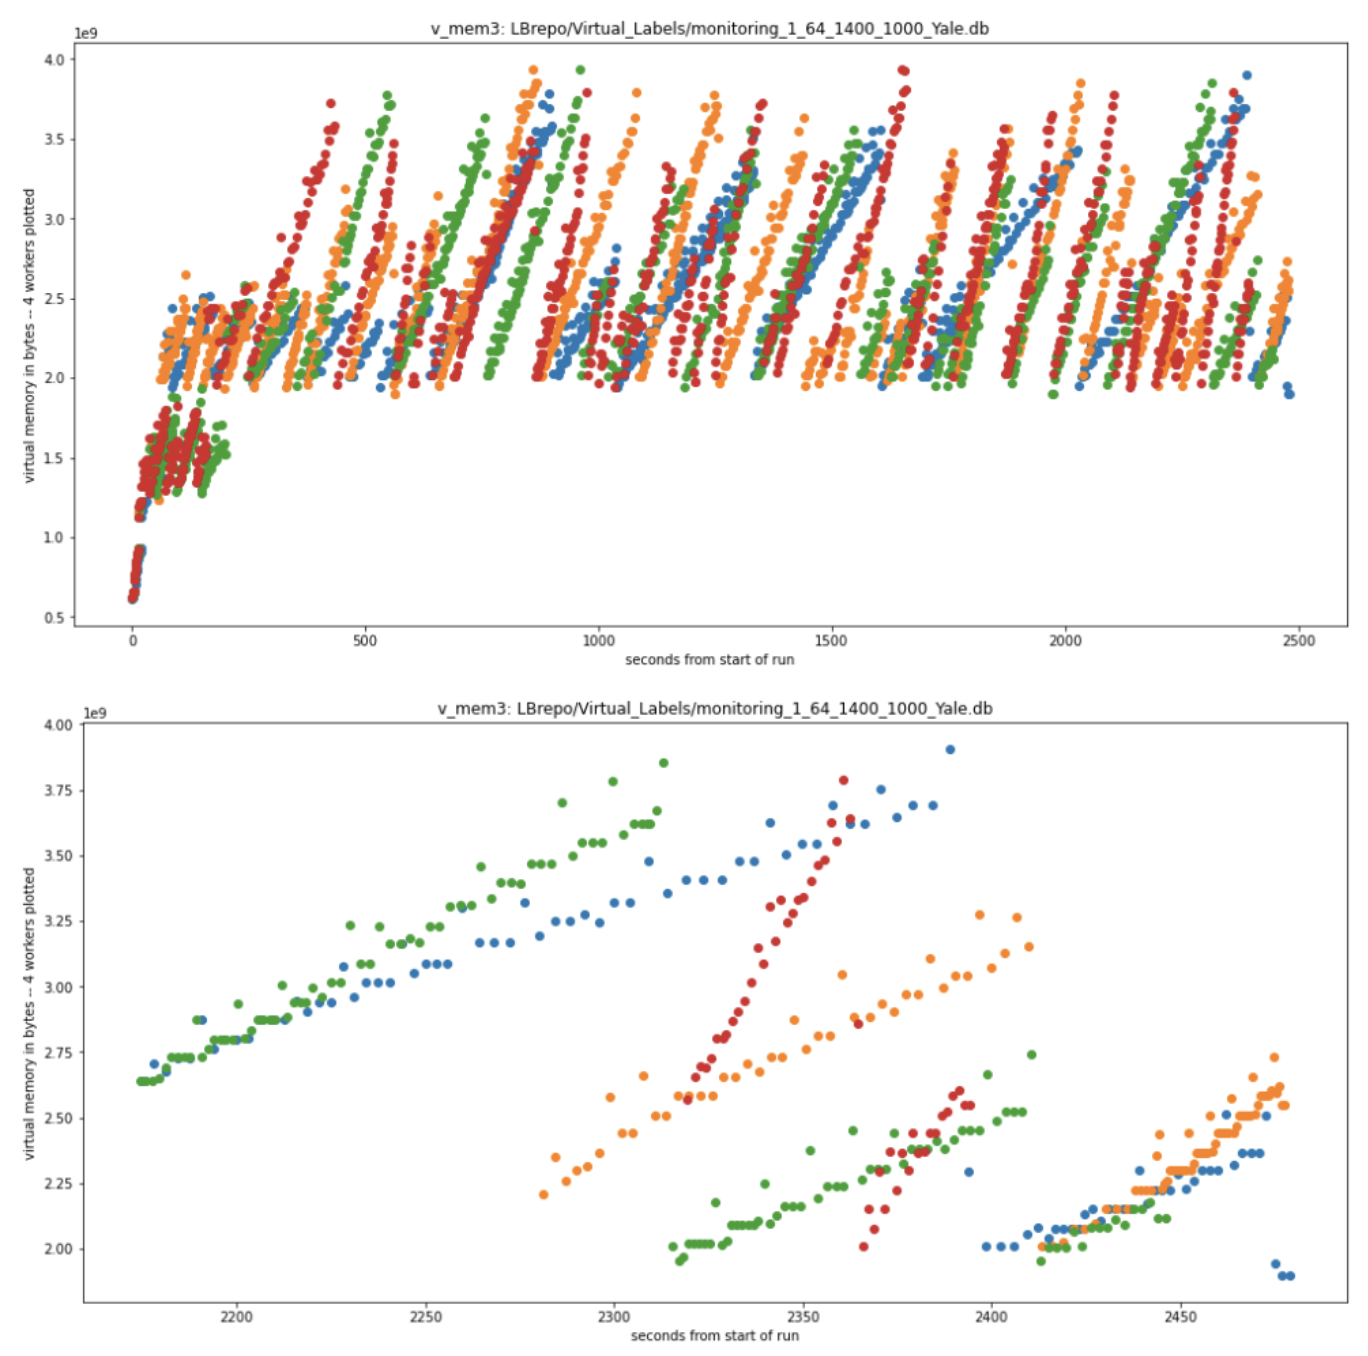
Figure 3: Visualization of the virtual memory allocated to each of several parsl workers over the course of a typical processing run (top) and a detail of the final task in each of these workers (bottom). (Image courtesy of the LightningBug Project, Mark Hereld.)
Explaining the fluctuations: The bottom panel zooms in on the final task of the run for each worker to see details in the behavior of its virtual memory footprint. These four final tasks require different amounts of wall time. For example, green starts before 2200 s and ends at about 2450 s, while red starts around 2320 s and ends just before 2400 s. Resetting of virtual memory to baseline appears to happen as needed and is not tied to the start of the app invocation or any other feature of these plots tied to either the app or the app scheduling. Particularly evident in the green and orange workers are the stepwise increments in virtual memory. The number of steps matches the number of images processed in the task by the app, linking these increments in virtual memory allocation to the inner loop of the app.
Testing a theory: All of this suggests that the high water mark in allocated virtual memory is driven by whatever garbage collection policy is in place. Below is a comparison between the native garbage collection behavior and periodic forced garbage collection (at the end of each inner loop of the app). The blue points show the native behavior. A second run with garbage collection forced at the end of each image analysis cycle within a task shows a much lower high water mark for the virtual memory used by this worker.
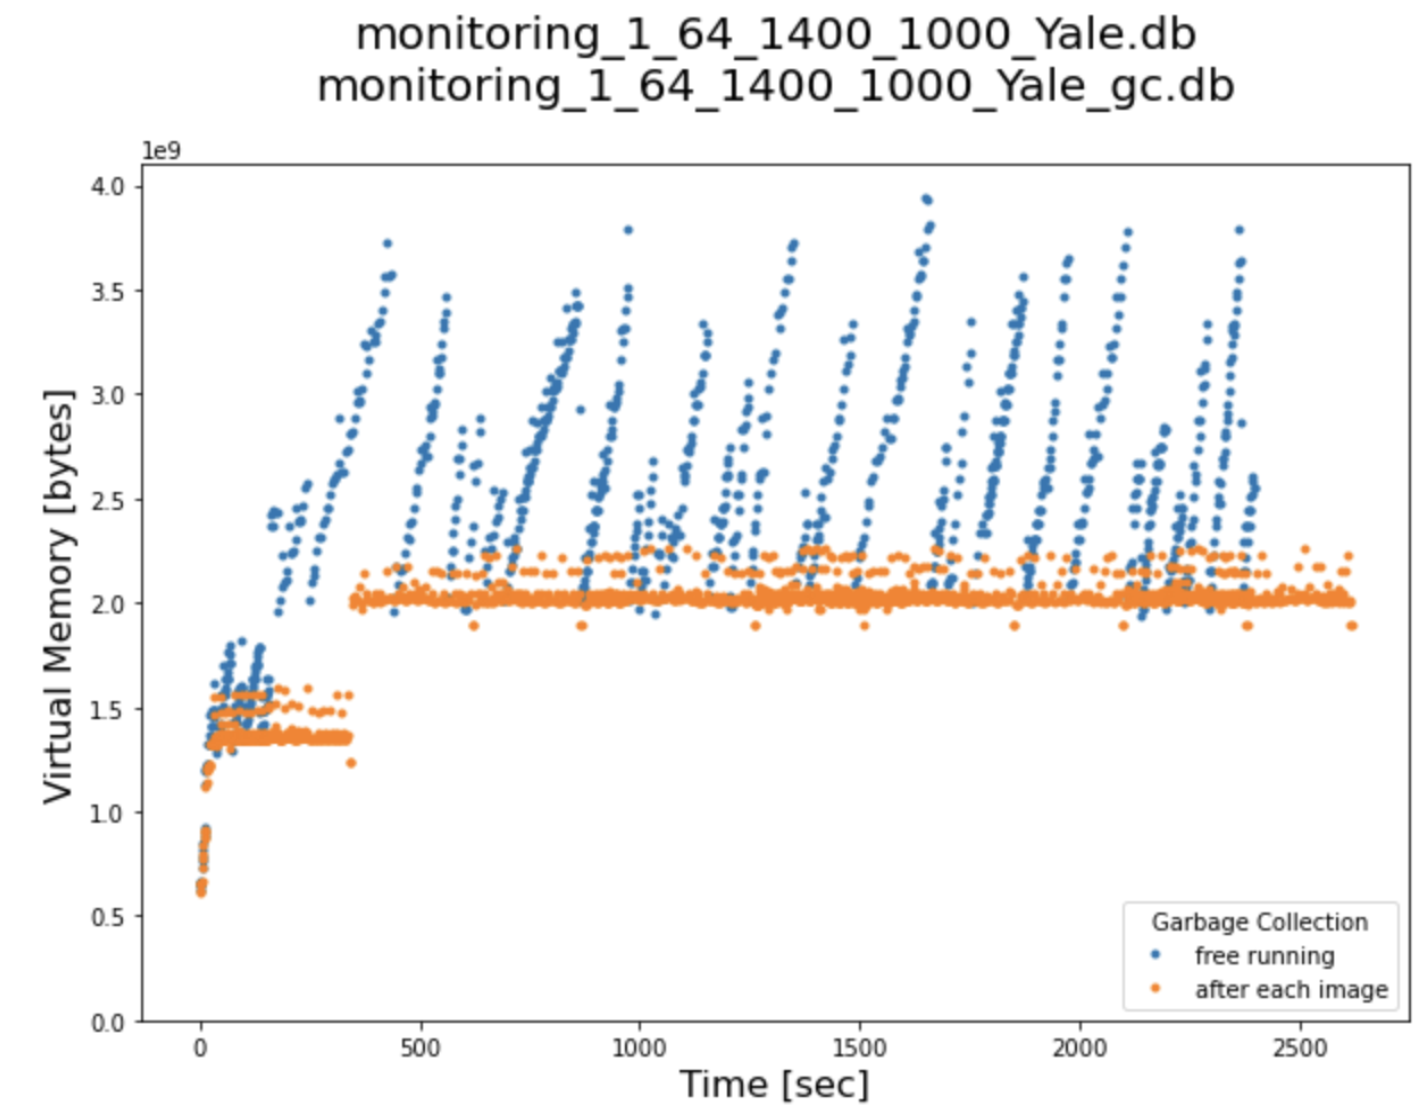
Figure 4: Comparison of the virtual memory usage by a single parsl worker under the nominal garbage collection policy (blue) and with more frequent periodic forced garbage collection (yellow). (Image courtesy of the LightningBug Project, Mark Hereld.)
Conclusion
So, forced garbage collection really helped! Perhaps these frequent forced housekeeping activities added some time to the overall run – I haven’t done enough to demonstrate this, but it wouldn’t be surprising. If so, calling on garbage collection less frequently would be easy. Nonetheless, this is what I think was happening. The independent swings in allocated memory per worker to nearly 4 GB were making it probable that 64 such workers would deplete the available 192 GB per node at some point. Forcing more frequent garbage collection has made the peak excursion per worker well under the 3 GB nominal mean limit. My problem is solved for now: I have not had any more faults of this sort and don’t expect any.
ℹ️ For more information on the LightningBug Project, its pipeline development, and this Parsl fix – contact Mark Hereld.